China Top 10 Lithium Automotive Battery Manufacturers?
China’s lithium automotive battery industry is no longer just a manufacturing story. It is a contest over scale, chemistry, reliability, and the supply chains behind each electric vehicle. The International Energy Agency reported that global demand for electric-vehicle batteries exceeded 750 GWh in 2023, rising about 40% year on year. China represented nearly 60% of global electric-car sales that year, making its battery makers central to the market’s direction. The figures are striking. They do not, by themselves, tell buyers which manufacturer is best.
Benchmark Mineral Intelligence founder and chief executive Simon Moores has described lithium as “the new oil.” The comparison captures its strategic importance, but it can oversimplify a changing industry. Lithium-ion batteries depend on more than lithium: cell design, manufacturing quality, safety testing, and access to materials all matter. A specification sheet cannot show every difference. Nor can a single year’s shipment figures predict long-term performance.
This overview examines ten leading Chinese lithium automotive battery manufacturers and the factors that distinguish them. It considers production scale, battery technologies, vehicle partnerships, and publicly reported market data. Rankings can vary by source, measurement period, and whether the figures cover cells, installed capacity, or shipments. That caveat matters. Readers should treat any top-ten list as a useful starting point, not a final verdict. Real-world performance depends on the vehicle, operating conditions, and years of use—details that headline numbers often leave out.
How the Top 10 Are Ranked: 2023 Global EV Battery Demand Reached 705.5 GWh
A ranking of China’s leading lithium automotive battery manufacturers should begin with a clear measure: battery demand, not factory announcements. In 2023, global electric-vehicle battery demand reached 705.5 GWh. That figure reflects batteries installed in vehicles worldwide, making it a useful indicator of market scale. It does not, by itself, reveal production capacity, profitability, or product quality.
A fair comparison should examine each manufacturer’s share of installed demand, the consistency of its reported data, and its ability to supply different vehicle segments. Capacity matters, but a large plant is not proof of strong customer demand.
Nor does one year tell the whole story. Prices, vehicle sales, and inventory changes can shift rankings quickly. Details matter. Figures may also vary between sources because reporting periods and battery categories are not always identical. That uncertainty deserves attention, not concealment.
A top-ten list is most useful when it states its data basis, separates measured demand from announced capacity, and treats close rankings cautiously. The 705.5 GWh benchmark gives readers context, while careful definitions help them judge what the ranking actually measures.
CATL and BYD: Together Supplied 52.6% of Global EV Batteries in 2023
China’s lithium-ion battery sector matters because two domestic manufacturers supplied 52.6% of global electric-vehicle battery demand in 2023. SNE Research reported that global usage reached 705.5 gigawatt-hours. One supplier accounted for 36.8%, while another held 15.8%. Together, their installed batteries exceeded 371 gigawatt-hours—enough capacity to power millions of electric cars. That is a striking concentration.
The figures measure batteries installed in vehicles, not factory output or total production capacity. This distinction matters when comparing manufacturers. The International Energy Agency’s Global EV Outlook 2024 estimated that electric-car sales approached 14 million in 2023, or about 18% of new car sales worldwide. Growing demand helps explain the scale, but market share alone cannot show durability, safety performance, or supply-chain resilience. A battery pack is more than a percentage: it must deliver reliable range through repeated charging, heat, and winter cold. The ranking is useful, yet incomplete. SNE Research’s figures provide a clear snapshot, not a forecast.
China’s Lithium Automotive Battery Manufacturers: A 2023 Market Snapshot
2023: The two largest suppliers together accounted for 52.6% of global EV battery installations. All other suppliers combined accounted for the remaining 47.4%.
Profiles of China’s Other Leading Battery Makers by Output and Technology
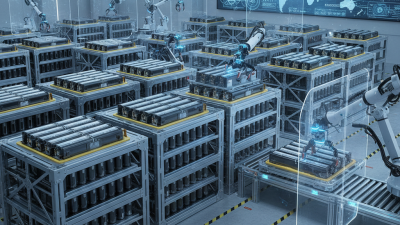
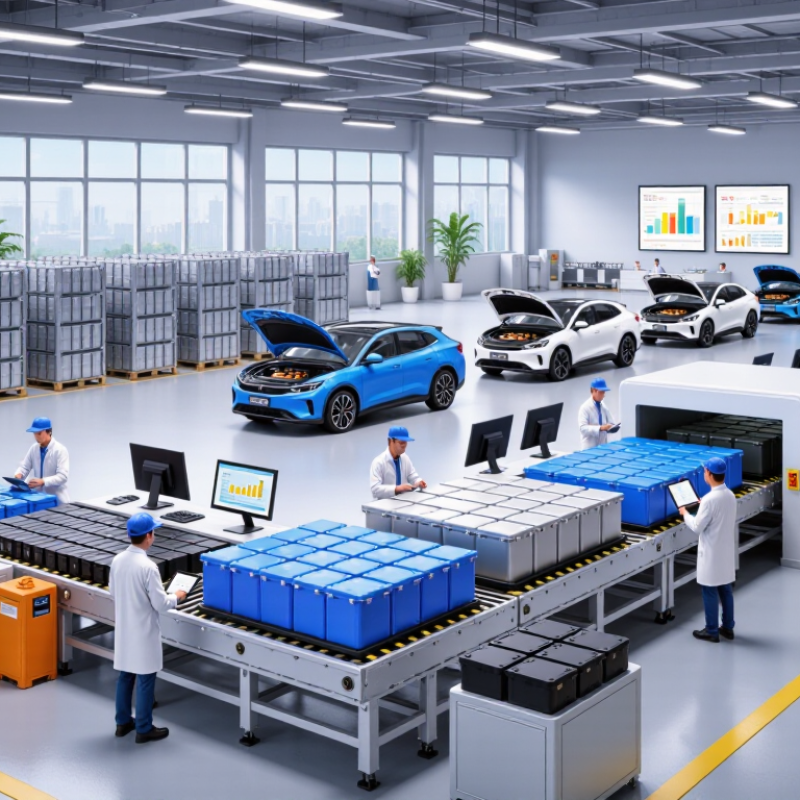
China’s leading battery makers are not a uniform group. The China Automotive Battery Innovation Alliance reported 548.4 GWh of domestic power-battery installations in 2024. Production reached 1,096.8 GWh, according to China’s Ministry of Industry and Information Technology. The gap matters: output includes batteries not installed in vehicles that year. It also reflects inventory, exports, and changing demand. Scale is visible on factory floors, where automated coating lines and dry rooms support high-volume cell production. But capacity figures alone do not reveal yield or profitability.
Beyond the largest suppliers, other Chinese producers compete through focused technologies and customer niches. Some specialize in lithium iron phosphate cells, valued for cost and thermal stability. Others develop high-nickel chemistries, silicon-enhanced anodes, or cell-to-pack designs that reduce unused space. The International Energy Agency’s Global EV Outlook 2025 describes continued growth in battery demand, alongside rapid shifts in chemistry and supply chains. That creates room for makers with reliable process control, not just announced capacity. Small differences matter. A few percentage points in production yield can affect cost across millions of cells. Still, public data rarely separates nameplate capacity from actual utilization; comparisons deserve caution. One awkward truth: impressive output can coexist with thin margins.
China Top 10 Lithium Automotive Battery Manufacturers? — Profiles of China’s Other Leading Battery Makers by Output and Technology
An anonymized comparison of China-based suppliers, ranked by estimated 2023 global electric-vehicle battery installations.
| Rank |
Manufacturer profile |
2023 global EV battery installations |
Approx. global share |
Technology and product focus |
Market profile |
| 1 |
Profile A |
259.7 GWh |
36.8% |
Broad portfolio spanning LFP and nickel-rich chemistries; cell-to-pack and cell-to-chassis integration approaches. |
Largest supplier in the cited 2023 global installation ranking. |
| 2 |
Profile B |
111.4 GWh |
15.8% |
LFP-focused blade-format cells, with a strong emphasis on pack integration and cost efficiency. |
High-volume supplier with substantial in-house vehicle demand. |
| 3 |
Profile C |
39.4 GWh |
5.6% |
LFP and ternary lithium-ion products for passenger vehicles and commercial applications. |
One of the leading independent Chinese cell suppliers by installed volume. |
| 4 |
Profile D |
32.3 GWh |
4.6% |
LFP and ternary cells; product development includes battery-pack integration and energy-storage applications. |
Supplies domestic vehicle programs and pursues overseas manufacturing partnerships. |
| 5 |
Profile E |
17.8 GWh |
2.5% |
Large-format LFP and ternary cells, alongside cylindrical-cell development and energy-storage products. |
A diversified battery producer serving automotive and non-automotive markets. |
| 6 |
Profile F |
16.6 GWh |
2.4% |
Automotive battery cells and packs, with related expertise in consumer and power batteries. |
Supplies vehicle makers and develops battery-system integration capabilities. |
| 7 |
Profile G |
16.1 GWh |
2.3% |
Known for pouch-cell development and ternary lithium-ion batteries, with a focus on energy density. |
Serves passenger-vehicle programs and has pursued international partnerships. |
| 8 |
Profile H |
12.6 GWh |
1.8% |
LFP and ternary battery systems; development work includes cell-to-pack integration and fast-charging solutions. |
Expanding supply relationships with domestic and international automakers. |
| 9 |
Profile I |
11.2 GWh |
1.6% |
LFP and ternary lithium-ion products, with battery-system development for electric vehicles and storage. |
A growing supplier with manufacturing and customer expansion plans. |
| 10 |
Profile J |
8.6 GWh |
1.2% |
Automotive lithium-ion cells and battery systems, including localized manufacturing for regional vehicle markets. |
Internationally oriented supplier with production operations across multiple regions. |
Data note: Volumes and shares are 2023 global EV battery installation estimates, not factory production capacity or total battery shipments. Figures are rounded; market shares are calculated against an approximately 705.5 GWh global total. Technology descriptions are broad public-domain summaries. Manufacturer identities are intentionally withheld. Source basis: SNE Research, 2023 global electric-vehicle battery usage ranking; company disclosures may use different reporting periods and definitions.
Battery Chemistries Explained: LFP Held Nearly 40% of the 2023 EV Market
Lithium iron phosphate, or LFP, supplied nearly 40% of the global electric-vehicle battery market in 2023, up from less than 10% in 2020, according to the International Energy Agency’s Global EV Outlook 2024. That rapid shift reflects practical trade-offs. LFP cells avoid nickel and cobalt, use abundant iron and phosphate, and generally tolerate frequent charging well. For drivers, that can mean a durable, lower-cost battery.
The trade-off
The compromise is lower energy density than many nickel-rich chemistries, which can limit driving range for a similarly sized pack. That matters.
Nickel-manganese-cobalt batteries remain useful where longer range and lighter packs are priorities. The IEA notes that chemistry choices also depend on mineral prices, manufacturing capacity, and vehicle design—not just laboratory performance.
A city car
With predictable daily routes may suit LFP.
A larger vehicle
Designed for long trips may favor higher energy density.
But these are tendencies, not rules. Real-world range also changes with temperature, speed, payload, and battery management. LFP is not automatically the best choice for every driver, and headline market share can hide differences between regions and vehicle segments.
The takeaway: Battery chemistry deserves a closer look than a single ranking can provide.
Comparing the Top 10 by Capacity, Customers, and Global Expansion
Comparing China’s ten leading lithium automotive battery manufacturers requires more than ranking announced capacity. Nameplate capacity describes what factories could produce, not what they actually ship. Utilization, product mix, and customer demand matter. A line designed for passenger-car cells may not serve commercial vehicles equally well. Details matter.
Customer portfolios reveal another difference. Some manufacturers supply large automakers, while others serve several regional vehicle makers or energy-storage customers. Broad relationships can reduce dependence on one buyer, but they do not guarantee stable orders. Buyers should examine delivery records, battery performance, warranty provisions, and the share of revenue tied to major customers. Public figures may use different reporting periods, so direct comparisons can mislead.
Global expansion is visible in overseas factories, local engineering teams, and partnerships with vehicle producers. These investments can shorten delivery routes and help manufacturers adapt products to local driving conditions. Yet a planned facility is not the same as a fully operating plant. Construction delays, workforce training, and supply-chain coordination can change timelines. Capacity forecasts deserve careful checking; even credible estimates can age quickly.