Who Are the Top Lithium Auto Battery Manufacturers in China?
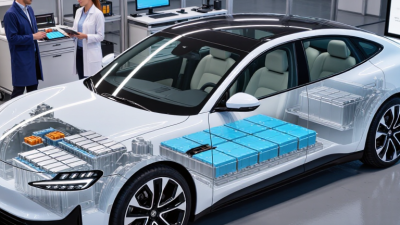
China’s lithium auto battery industry is not a single leaderboard. It is a network of cell makers, vehicle suppliers, and technology specialists. CATL and BYD lead by scale, while companies such as CALB, Gotion High-Tech, EVE Energy, and Sunwoda compete across different vehicle segments. The differences matter.
SNE Research reported that global electric-vehicle battery installations reached 1,071.9 GWh in 2024, up 25.2% year over year. In its annual analysis, CATL supplied 339.3 GWh, or 37.9% of the measured market; BYD supplied 153.7 GWh, or 17.2%. These figures track batteries installed in vehicles, not total factory output or announced capacity. That distinction is easy to miss.
CATL founder and chairman Robin Zeng has expressed the industry’s direction this way: “The future of the world is electrification, and the future of electrification is batteries.” The quote captures the ambition, but not every trade-off. Chemistry, safety performance, price, manufacturing scale, and supply-chain resilience all shape which manufacturer fits a particular buyer or automaker. A large market share alone cannot settle that question. This overview compares leading Chinese manufacturers through their scale, battery technologies, customer reach, and position in a fast-changing market. It also treats rankings as a useful snapshot—not a guarantee of future leadership.
How SNE Research Ranks China’s EV Battery Makers by 2024 Installations
SNE Research ranks China’s EV battery makers by 2024 installations, a measure of battery capacity fitted into vehicles during the year. It is not a factory-output table. A pack installed in a car counts; battery cells still waiting in a warehouse do not.
That distinction matters.
The ranking helps show which manufacturers supplied the most capacity to the EV market, usually expressed in gigawatt-hours. It can reveal shifts in market share and the scale of demand from automakers. Yet installation data does not tell the whole story. Vehicle sales, pack size, export markets, and reporting coverage can all affect a company’s position. A larger total is not automatically proof of better safety, durability, or value.
Readers should compare the ranking with its stated boundaries: which vehicle types are included, how overseas installations are counted, and whether figures are preliminary or revised. Small methodological differences can change close positions. Numbers look precise. Their limits deserve attention, too. SNE Research’s table is useful evidence of market reach, but it should not be mistaken for a complete scorecard of engineering quality.
CATL: 37.9% of Global EV Battery Use in 2024, According to SNE Research
SNE Research reported that the leading Chinese electric-vehicle battery maker supplied 37.9% of global EV battery use in 2024. Its dataset recorded about 894.4 GWh of total use, putting the supplier’s contribution near 339 GWh. That is substantial. The figure reflects batteries installed in vehicles, not factory capacity, revenue, or every shipment.
The International Energy Agency’s Global EV Outlook 2025 says EV battery demand exceeded 1 TWh in 2024, rising roughly 25% year over year. These figures use different scopes, so they should not be treated as direct contradictions or combined casually. Together, they show how quickly battery demand is scaling—and why installation data matters when comparing manufacturers.
For buyers and analysts, a market share this large signals scale, broad supply relationships, and considerable influence over cell pricing and technology choices. Yet share alone does not prove better safety, durability, or performance in every vehicle. Those depend on cell chemistry, pack design, thermal management, and real-world operating conditions. A useful comparison should check the report’s measurement period and vehicle coverage. Statistics can look precise, but the boundaries behind them are easy to miss.
Global EV Battery Usage in 2024
Global electric vehicle battery usage reached 894.4 GWh in 2024, according to SNE Research. This chart shows the industry-wide total and does not include manufacturer or brand-level figures.
BYD: 17.2% of Global EV Battery Use in 2024, According to SNE Research
SNE Research reported that one Chinese battery manufacturer accounted for 17.2% of global electric-vehicle battery use in 2024. The firm’s annual analysis put worldwide battery use at about 1,184 GWh, making that share roughly 204 GWh. This is a substantial footprint. It reflects batteries installed in vehicles, not simply factory output or export volume. The distinction matters when comparing manufacturers.
A high share points to strong supply capacity and broad vehicle-market reach, but it does not tell the whole story. Battery chemistry, pack design, production yields, and customer mix also shape a manufacturer’s position. The International Energy Agency’s Global EV Outlook 2025 reported more than 17 million electric-car sales worldwide in 2024. That growing market helps explain the scale behind SNE’s figures, though battery-use rankings can differ from production-capacity rankings. Data definitions matter.
Tips: When reviewing a market-share claim, check its reporting period and whether it measures installed battery use, shipments, or manufacturing capacity. Small differences can change the comparison.
Other Chinese Leaders: CALB, Gotion, EVE Energy and Sunwoda
Beyond the biggest suppliers, four Chinese battery makers bring different strengths to the automotive market. Their portfolios span lithium iron phosphate and nickel-rich cell chemistries, but product fit depends on the vehicle, not a headline specification. A compact city car may prioritize cost and cycle life. A long-range model may need higher energy density and careful thermal management.
Some manufacturers emphasize large-scale production and partnerships with vehicle companies. Others stand out for battery formats, energy-storage experience, or flexible product development. These distinctions can affect pack design, factory integration, and supply continuity. Still, public capacity figures do not show how consistently a specific plant meets production targets. Small details matter.
For a serious comparison, buyers should examine independently verified test data, warranty terms, charging performance, and safety results for the exact cell or pack under review. Ask how performance changes in cold weather and after repeated fast charging. Check whether the supplier can support the intended production schedule. A good cell on paper is not automatically a good vehicle battery. I would also leave room for uncertainty: specifications can change between product generations, and supplier disclosures are not always directly comparable.
Who Are the Top Lithium Auto Battery Manufacturers in China? - Other Chinese Leaders: CALB, Gotion, EVE Energy and Sunwoda
| Industry dimension |
Established fact |
Why it matters for automotive batteries |
| Cell chemistry |
Lithium iron phosphate (LFP) and nickel-based chemistries such as NMC are widely used lithium-ion battery chemistries. |
Chemistry influences energy density, cost, thermal characteristics, and the vehicle’s operating range. |
| Cell formats |
Prismatic, cylindrical, and pouch cells are established lithium-ion cell formats. |
Format affects pack layout, cooling design, manufacturing processes, and how cells are integrated into a vehicle. |
| Battery management |
A battery management system monitors battery conditions, including cell voltage and temperature, and helps control charging and discharging. |
Monitoring and control support safe operation, performance, and battery-life management. |
| Safety requirements in China |
GB 38031-2020 is China’s mandatory safety standard for traction batteries used in electric vehicles. |
Compliance testing addresses safety risks relevant to battery systems and their use in electric vehicles. |
| Performance measures |
Common comparison measures include energy density, power capability, cycle life, charging performance, and usable capacity. |
A single metric does not describe overall suitability; performance depends on the vehicle design and operating conditions. |
| Manufacturing quality |
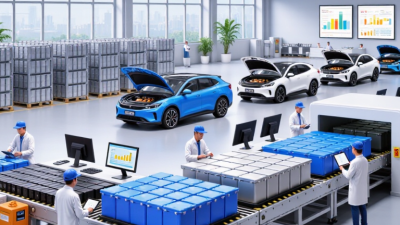
Automotive battery production involves controlled processes, inspection, and traceability across cells, modules, and packs. |
Consistent process control helps limit defects and supports reliable, repeatable battery-pack performance. |
| End-of-life management |
Battery recycling and material recovery are important parts of the lithium-ion battery value chain. |
Collection, safe handling, and recovery can reduce waste and return useful materials to the supply chain. |
How to Compare Manufacturers by Battery Chemistry, Capacity and Customers
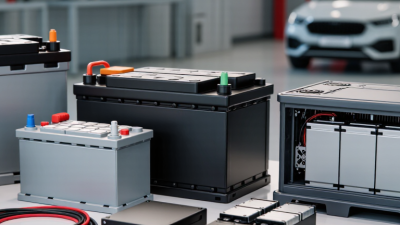
China has many lithium auto-battery manufacturers, but a headline ranking rarely shows which supplier fits a vehicle project. Compare chemistry against the vehicle’s actual duty cycle. Lithium iron phosphate can suit frequent charging and cost-sensitive designs, while nickel-rich chemistries may offer higher energy density. Neither is automatically better. Ask how performance changes in cold weather and after repeated fast charging.
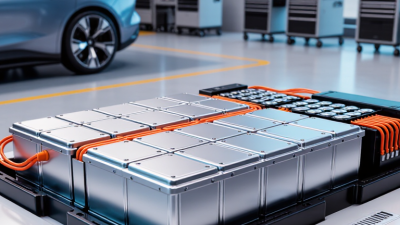
Check capacity in useful terms: cell amp-hours alone do not describe a complete pack. Compare pack kilowatt-hours, usable energy, peak power, weight, and thermal-management details. Then examine customer experience. Ask for references from similar vehicle types, production volumes, delivery records, and after-sales support. Quality certificates are useful, but they do not replace production and field data. Paper specifications can look tidy; real operating conditions are messier, and comparisons may miss that.
Tips: Request test results under matching conditions, not just the best-case figures. Confirm whether quoted capacity is nominal or usable. Ask what happens when a pack falls short of its stated performance. A clear answer matters. So does a verifiable one.